 carjourney
From the CarJourney journal
Calculate and Track Your Car's True Cost, Step by Step

Calculate and Track Your Car’s True Cost, Step by Step
Car TCO tracking is the practice of measuring every dollar a vehicle costs you over a chosen ownership period, and the fastest way to lower what you pay is to calculate a personalized 3 to 5 year total cost of ownership and start logging mileage and expenses today. Most owners only see the sticker price and the loan payment. That leaves out depreciation, insurance drift, tires, and the maintenance bills that show up right after the warranty expires.
Depreciation and recurring costs are what actually decide whether a car was a good financial choice, not the number on the price tag. Kelley Blue Book’s Cost to Own model treats depreciation as the biggest single line item over five years, often outweighing fuel, insurance, and repairs combined. That’s the number most buyers never calculate before signing.
Your immediate next step: run a personal 3 to 5 year TCO estimate using your actual purchase price, financing terms, and driving habits, then set up a simple habit for logging every fuel fill and repair going forward.
- Estimate depreciation, financing, fuel, insurance, maintenance, and fees for your specific vehicle and location
- Start a log now, even a basic spreadsheet, so real numbers replace estimates within a few months
- Revisit the estimate every year as rates, insurance premiums, and resale values shift
Quick fact: New vehicles typically lose a significant portion of their value in the first year alone, according to CalcFi’s ownership cost data, which is often more than a full year of fuel and insurance combined.
TL;DR:
- Most vehicles lose a significant portion of their value in the first year, often more than a year’s fuel and insurance costs combined.
- Depreciation usually accounts for the largest part of total ownership expenses over five years, often outweighing fuel, insurance, and repairs.
- Generic online calculators provide rough estimates but exclude location-specific costs like parking, tolls, and custom maintenance needs, which can significantly impact actual expenses.
- Building a habit of regular, detailed logging of fuel, maintenance, and fees using automated tools results in more accurate cost tracking than relying on static calculations.
- Prioritizing resale value and shortening loan terms can save thousands over five years, making them more effective strategies than focusing solely on upfront price or monthly payments.
Table of Contents
- What Total Cost of Car Ownership Actually Includes
- How Do Online TCO Calculators Estimate Your Costs?
- How to Calculate Your Personal 5-Year TCO
- Building a Real Tracking Workflow That Sticks
- How CarJourney Turns This Workflow Into a Habit
- Ways to Lower Your Car’s Total Cost of Ownership
- What the Numbers Actually Tell You About Ownership
- Track Your Car’s True Cost Without the Spreadsheet Headache
- Key Takeaways
- Sources
What Total Cost of Car Ownership Actually Includes
The formula is simple even if the inputs aren’t: purchase price plus every ownership cost over your holding period, minus what you eventually recover at resale or trade-in. Total cost of car ownership isn’t one number. It’s a stack of overlapping expenses that most buyers track poorly, if at all, which is exactly why car TCO tracking exists as a discipline rather than a one-time calculation.
Here’s what belongs in that stack:
- Depreciation — the gap between what you paid and what the car is worth when you sell it
- Financing costs — interest paid over the loan term, which compounds with longer terms
- Fuel or electricity — driven by your mileage, driving style, and vehicle efficiency
- Insurance — varies by driver record, location, coverage level, and vehicle model
- Maintenance and repairs — scheduled service plus the unplanned stuff that always shows up
- Taxes and registration — annual fees and one-time taxes that vary by state
- Tires — a cost owners routinely forget to budget for separately
- Parking and tolls — invisible in most calculators but real in daily commuting costs
- Opportunity cost — what your down payment could have earned elsewhere
Depreciation usually dominates the total. AAA’s ownership cost methodology sums depreciation alongside financing, fuel, insurance, fees, and maintenance, and depreciation consistently comes out on top for new vehicles held five years or less. A car that loses half its value by year five has effectively cost you more in lost equity than in gas.
By the numbers: Vehicles can lose a substantial portion of their original value over five years, according to CalcFi, depending heavily on make and model. Some vehicles hold value far better than others, which is why resale reputation matters as much as fuel economy when you’re picking a car in the first place.
How Do Online TCO Calculators Estimate Your Costs?
Most calculators build their estimates on the same skeleton: a 3 to 5 year ownership window, an assumed annual mileage figure (usually 12,000 to 15,000 miles), and national or state-level averages for fuel, insurance, and maintenance. AAA’s Your Driving Costs tool lets you adjust for your state and annual mileage, which improves accuracy over a flat national number, but it still can’t know your specific driveway, your specific commute, or your specific mechanic’s rates.
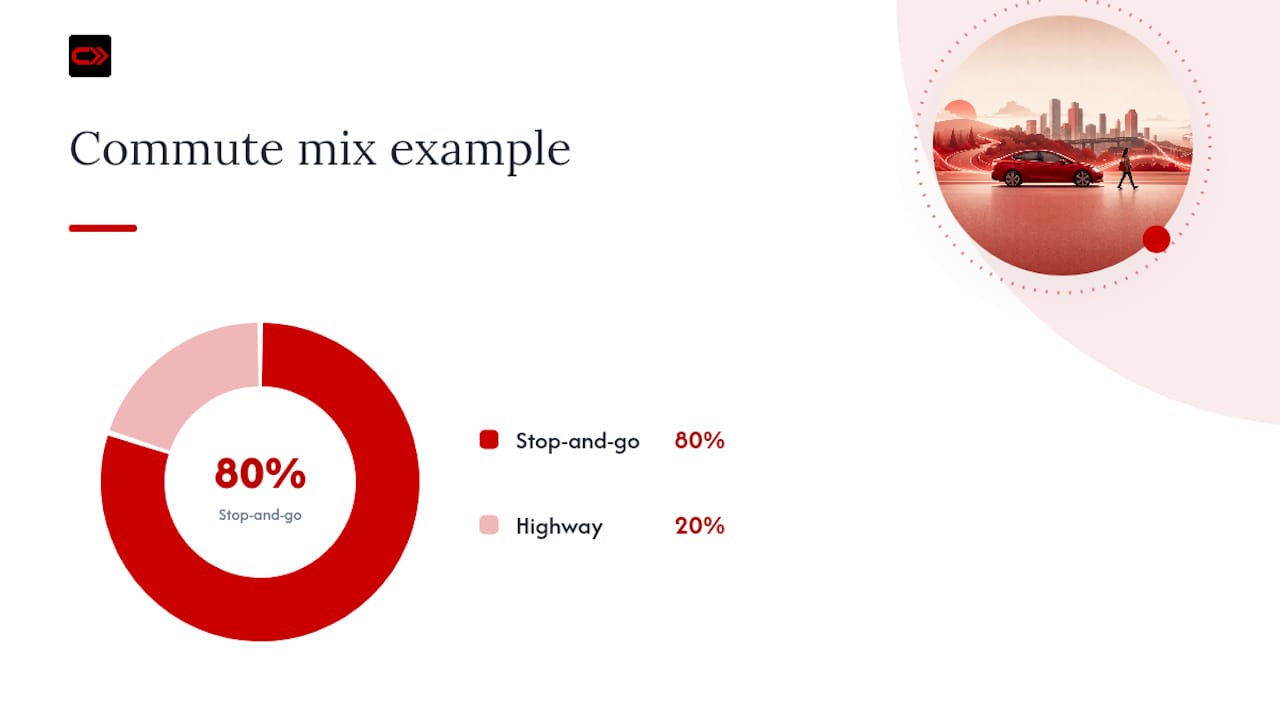
That’s the tradeoff. A generic calculator gives you a fast, reasonable ballpark. It won’t know that you park in a garage that costs $200 a month, that your commute is 80% stop-and-go traffic, or that your particular trim level needs synthetic oil every 5,000 miles instead of 7,500.
Here’s what most calculators leave out entirely:
- Parking fees, tolls, and city-specific congestion charges
- Location-specific insurance swings (urban rates can run double rural rates for identical coverage)
- Custom maintenance schedules for modified or high-performance vehicles
- Aftermarket parts, upgrades, or the resale impact of modifications
- Your actual driving mix of city versus highway miles, which changes real fuel costs
Pro Tip: Use a generic calculator for the first pass when you’re comparing two or three cars you’re considering buying. Switch to a personalized calculation the moment you own the car, because that’s when the averages stop being useful and your actual numbers start mattering.
A calculator is good enough when you’re shopping and want a rough side-by-side comparison. It stops being good enough the day you drive the car home, because from that point forward, tracking beats estimating every time.
How to Calculate Your Personal 5-Year TCO
Building your own TCO estimate takes about twenty minutes if you gather the right numbers first. Here’s the exact process.
Step 1: Gather your inputs.
- Purchase price (or agreed price if you haven’t bought yet)
- Expected resale value at your planned sale date (check KBB or NADA guides for your specific model)
- Loan interest rate and term, or your annual opportunity cost rate if paying cash
- Annual mileage, split by city and highway if possible
- Local fuel price and your vehicle’s combined MPG rating
- Annual insurance premium quote for your specific coverage level
- Expected annual maintenance cost (use the manufacturer’s schedule as a floor)
- State registration fees, personal property tax if applicable, and sales tax paid upfront
- Monthly parking and toll costs, if any
Step 2: Calculate depreciation. Subtract your expected resale value from the purchase price. The Department of Energy’s vehicle cost tool stresses that your specific driving pattern changes fuel estimates significantly, and the same logic applies to depreciation: a model-specific resale curve beats a flat annual percentage, since some cars hold value in year three and then drop sharply in year five.
Step 3: Calculate financing cost. Multiply your loan balance by your interest rate across the term, or use your auto loan’s amortization schedule if you have one. If you’re paying cash, apply a conservative opportunity cost rate to your down payment.
Step 4: Total everything and divide by miles driven. Add depreciation, financing, fuel, insurance, maintenance, taxes, fees, and parking. Divide the five-year total by total miles driven to get your cost per mile, a number that makes it easy to compare against public transit, ride-shares, or a different vehicle entirely.
Total five-year cost: $43,590. Divided across 65,000 miles, that’s roughly $0.67 per mile, a figure worth comparing against AAA’s average driving cost benchmarks to see whether your specific vehicle runs above or below typical ownership costs. Notice how financing and depreciation both shrink over time while maintenance climbs, a pattern that holds for almost every vehicle once the warranty period ends.
Building a Real Tracking Workflow That Sticks
A one-time calculation tells you what to expect. A tracking workflow tells you what’s actually happening, and the gap between those two numbers is usually where the real savings or overspending hides.
Start with what you log every time you’re at the pump or the shop:
- Fuel fills — record the odometer reading, gallons purchased, and total cost every time
- Maintenance and repairs — date, odometer, exactly what was done, parts cost, and labor cost
- Insurance and registration payments — the amount and the coverage period it applies to
- Loan payments — principal and interest split if your lender provides it
- Parking and tolls — even small recurring charges add up over a year
Tag each entry with a consistent category from the start, because retroactively sorting six months of receipts into buckets is exactly the kind of task that makes people give up on tracking altogether. Use categories like fuel, scheduled maintenance, unscheduled repair, insurance, registration, tires, and parking/tolls. Keep the category names identical every time. “Oil change” and “maintenance” as separate tags will quietly wreck your totals later.
Cadence matters more than precision. A quick 30-second entry at the pump beats a perfectly detailed spreadsheet you fill out once a year from memory. Reconcile monthly: pull up your entries, check that fuel receipts match your fill-up log, and confirm odometer readings are climbing consistently. Community-maintained expense trackers on platforms like GitHub’s open-source vehicle tools consistently recommend monthly reconciliation specifically to avoid double-counting fuel entries that get logged in two categories at once.
Pro Tip: Photograph every receipt the moment you get it, even if you plan to enter the data later that night. Faded gas station receipts and illegible shop invoices are the number one reason owners lose track of six months of maintenance history.
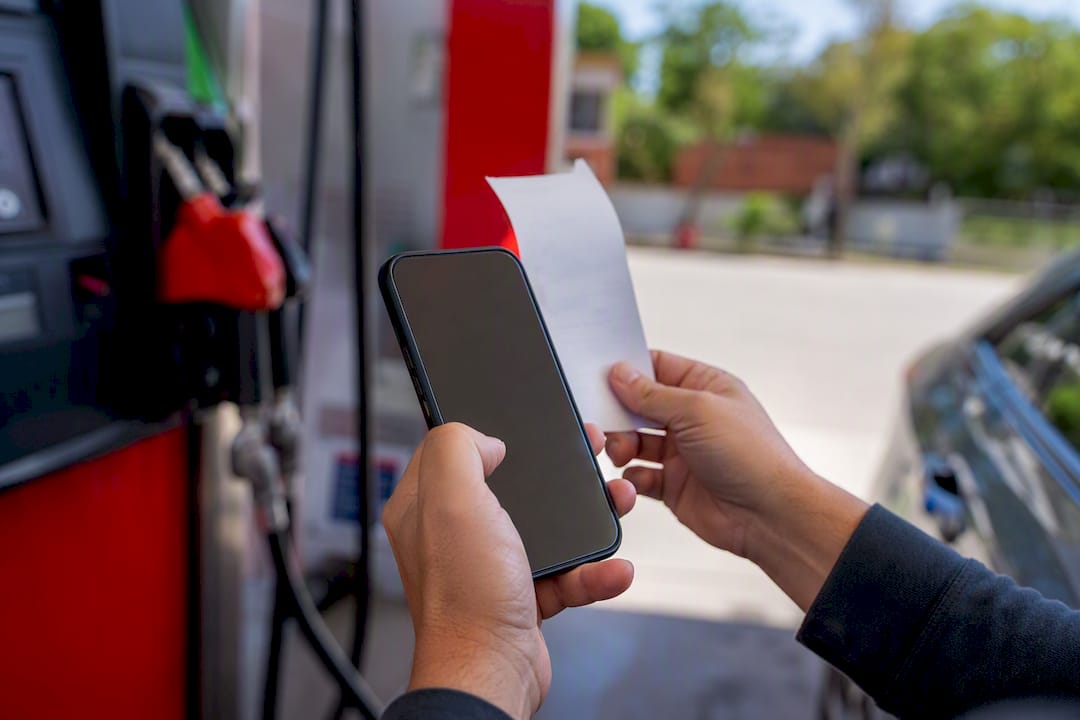
Export a quarterly report if your tracking method supports it. Seeing your cost-per-mile trend line quarter over quarter tells you things a single annual number never will, like whether a repair spike was a one-time fluke or the start of a pattern worth addressing before it gets expensive.
How CarJourney Turns This Workflow Into a Habit
Most of the workflow above lives or dies on friction. If logging a fuel fill takes ninety seconds and a maintenance receipt requires manual data entry, most owners quit within a few months. That’s the gap CarJourney was built to close.
The platform maps directly onto the logging steps that matter for accurate TCO tracking:
- AI-powered document scanning reads service receipts and invoices, pulling out date, odometer, item, and cost automatically instead of requiring manual entry
- Fuel logging ties directly to odometer readings, which keeps your cost-per-mile calculation accurate without separate spreadsheet math
- Maintenance reminders are generated from your vehicle’s actual service history rather than a generic manufacturer schedule, so you’re not guessing when the next interval hits
- Build profiles let you document modifications and upgrades alongside standard maintenance, which matters if resale value or a future sale is part of your ownership plan
- Exportable reports give you the quarterly view that manual spreadsheet tracking rarely produces consistently
Frictionless logging habits, quick entries at the pump, photographed receipts captured in the moment, are what separate owners who track TCO accurately for years from owners who give up after month three. Purpose-built tracking tools outperform spreadsheets precisely because they remove the friction that causes people to quit.
Your data stays exportable, so switching tools or pulling records for a future sale doesn’t mean starting from scratch. If you’re already tracking maintenance manually, the transition usually starts with importing your existing maintenance history and letting the reminders take over from there.
Ways to Lower Your Car’s Total Cost of Ownership
Once you know your numbers, you can actually act on them. Small decisions at the buying stage and in daily habits compound over five years.
- Buy for resale value, not just sticker price. A model with strong resale reputation can save you more over five years than a cheaper car that depreciates fast, since depreciation is typically the largest expense any owner faces.
- Skip options you won’t use. Every added feature adds to the purchase price and rarely returns its full value at resale.
- Consider certified pre-owned. You skip the steepest depreciation curve of year one while still getting a warranty.
- Shorten your loan term when you can. A 48-month loan costs meaningfully less in interest than a 72-month loan on the same vehicle.
- Shop insurance annually. Rates shift by provider, and loyalty rarely earns you a better deal.
- Stay ahead of maintenance. Skipped oil changes and delayed brake work turn into expensive repairs later.
- Drive efficiently. Smooth acceleration and steady highway speeds measurably improve fuel economy over stop-and-go habits.
What the Numbers Actually Tell You About Ownership
Most advice about car costs focuses on the wrong number. Buyers agonize over the sticker price and the monthly payment, then ignore depreciation entirely, even though it’s usually the single largest cost over five years. That’s backward. The car that costs $2,000 less upfront but loses value twice as fast can easily cost you more by year three.
The conventional wisdom to “buy what you can afford monthly” ignores the compounding effect of financing terms and resale value working against each other. A shorter loan on a car with strong resale value almost always beats a longer loan on a car that depreciates fast, even when the monthly payment looks worse on paper.
If you take one thing from this, prioritize building the tracking habit before you obsess over the calculation’s precision. A rough personal estimate updated monthly with real numbers will beat a perfect one-time spreadsheet that never gets touched again. The owners who actually save money are the ones who know their real cost per mile in year three, not the ones who ran a great calculator once at purchase.
— Chally
Track Your Car’s True Cost Without the Spreadsheet Headache
Spreadsheets work until they don’t. The moment you miss a month of logging or lose a paper receipt, your TCO numbers start drifting from reality, and rebuilding that history later is tedious enough that most owners just give up. Carjourney exists for the owners who want their real cost-per-mile without doing manual data entry every week.

The app scans your service documents with AI, ties fuel logs directly to your odometer, and builds maintenance reminders from your vehicle’s actual history rather than a generic schedule. If you’ve been tracking manually, you can bring your existing records over and pick up the reconciliation habit from there using a car ownership cost tracker built specifically for this. Enthusiasts who also modify their vehicles get build profiles that document upgrades alongside standard costs, useful if resale or a future sale factors into your plan. Start logging your first fuel fill or upload a recent service receipt at Carjourney and see your real cost per mile take shape within a few months instead of guessing at it once a year.
Key Takeaways
Tracking your car’s total cost of ownership over time, not just estimating it once, is what actually reveals whether a vehicle is saving or costing you money.
| Point | Details |
|---|---|
| Depreciation dominates | It’s typically the largest single ownership cost, often exceeding fuel and insurance combined over a multi-year period. |
| Calculators are a starting point | Generic tools use national averages and miss parking, tolls, and location-specific costs. |
| Track cost per mile | Divide your total five-year cost by miles driven to compare vehicles or transportation options fairly. |
| Consistency beats precision | Quick, frequent logging entries produce more reliable data than a perfect one-time calculation. |
| Carjourney automates the workflow | AI receipt scanning and odometer-linked fuel logs remove the manual entry that causes most owners to quit tracking. |
Sources
- A Total Cost of Ownership Car Calculator — Kelley Blue Book
- Estimate vehicle ownership costs — AAA
- Total Cost of Ownership Calculator — CalcFi